
Simulating Hurricane Risk to Price Insurance Losses
Published:
Insurers price hurricane risk using roughly 50 years of reliable storm data. That’s not enough to know what a true 1-in-500-year storm looks like, and climate change is making the historical record even less useful. Under-pricing that tail risk is how insurers go insolvent. I built a full probabilistic catastrophe model (the same class of system used by Verisk/AIR and Moody’s RMS) that simulates 10,000 years of physically plausible hurricanes against a synthetic $39.01B Gulf & Atlantic coast property portfolio, and prices the resulting insurance losses down to the dollar. 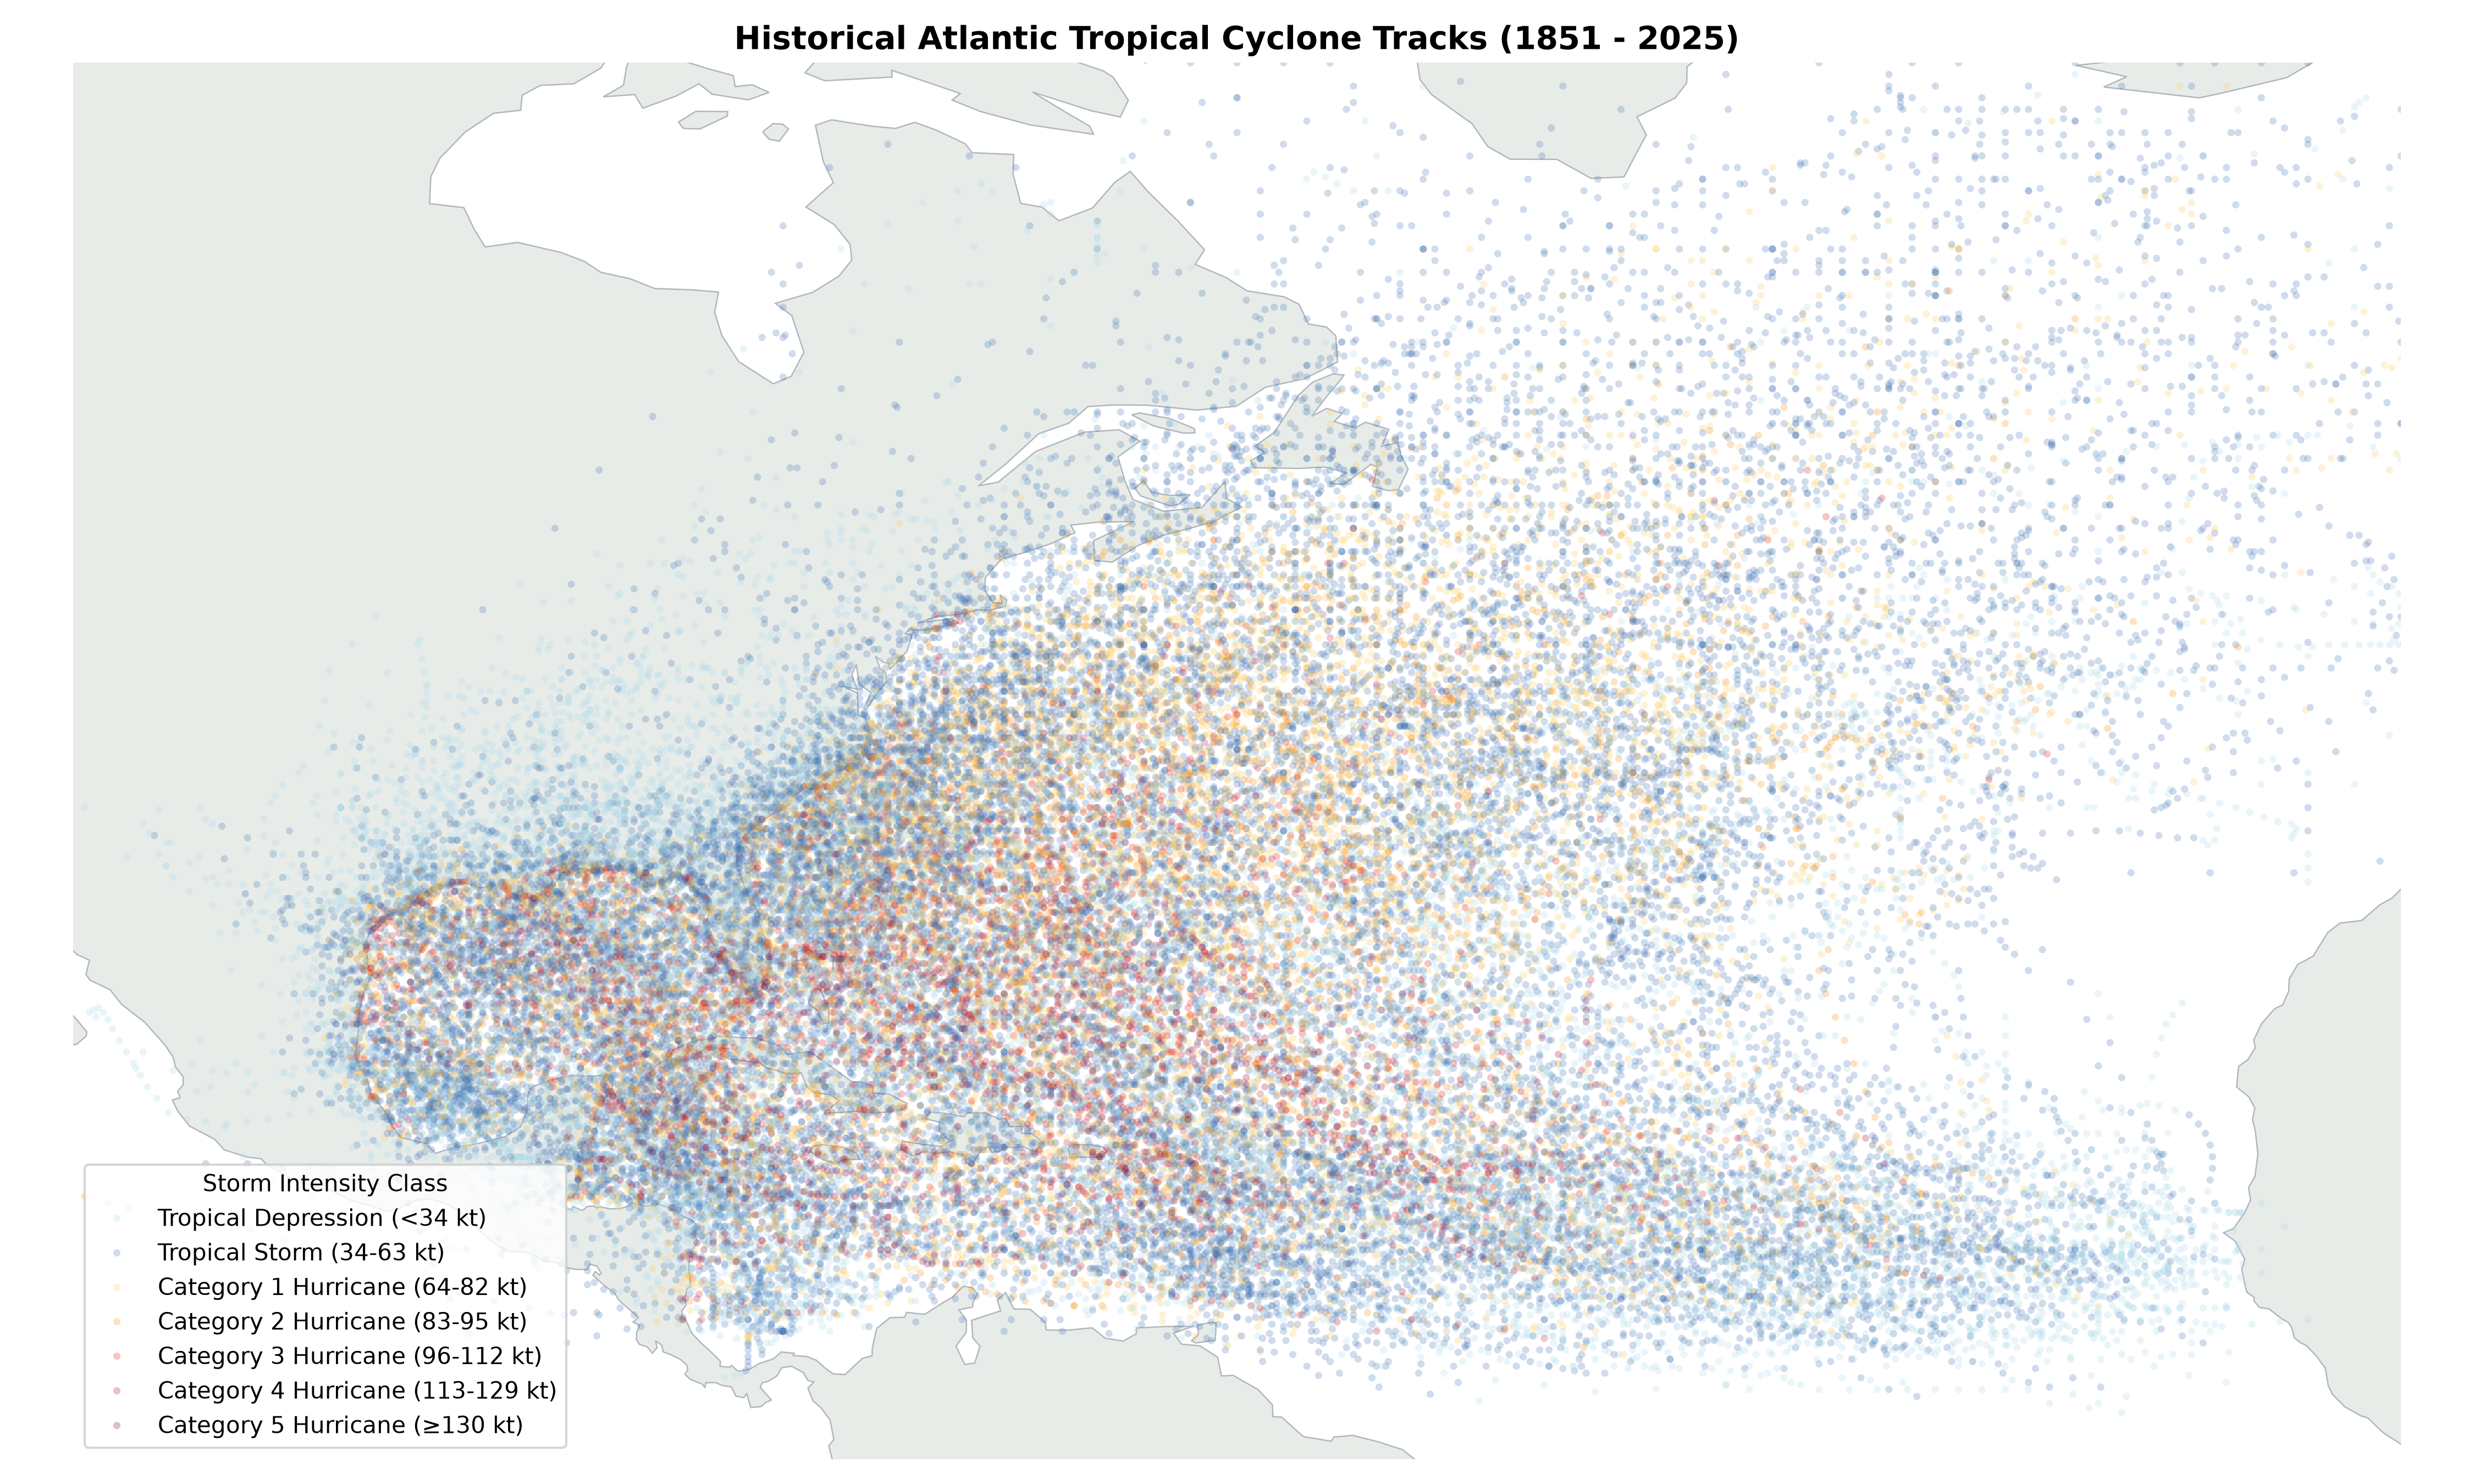 170 years of North Atlantic hurricane tracks (NOAA HURDAT2), the real data this simulation is built on.
 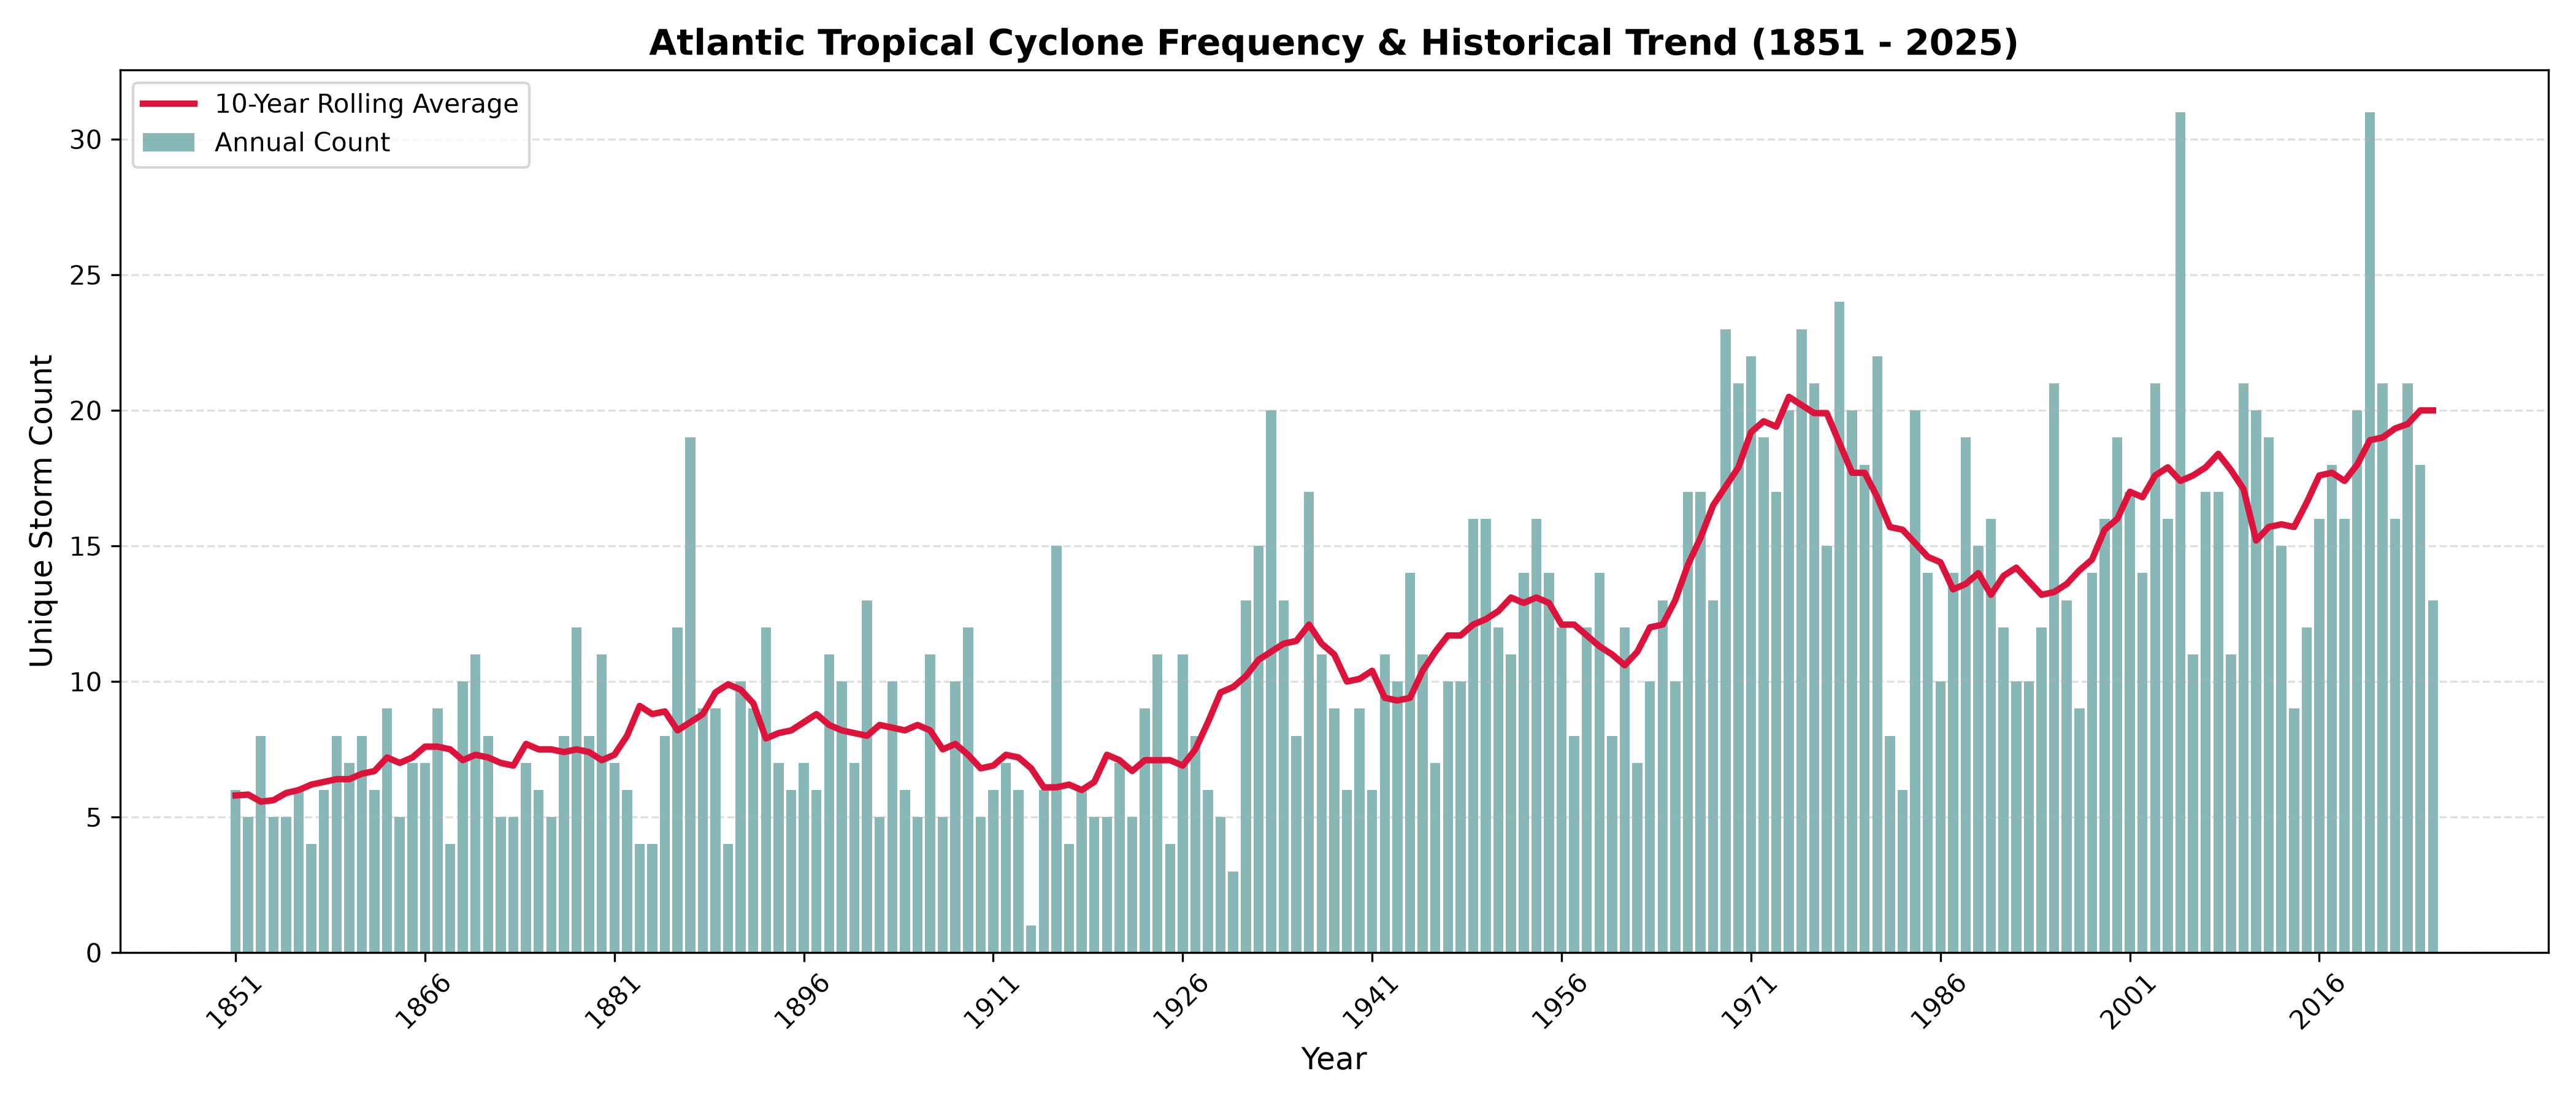 Storm counts have climbed over the historical record, though part of that rise is better satellite detection since the 1970s, not climate alone. Either way, it’s exactly the kind of short, shifting record that makes simulation necessary instead of simple averaging.
By the Numbers
| 🌀 10,000-year stochastic storm catalog | built from 170 years of NOAA HURDAT2 records |
| 🏠 10,000 properties, $39.01B insured value | synthesized from real NOAA county GDP data |
| 📊 500M+ simulated event-property interactions | the core computational bottleneck |
| 💾 50 MB peak memory | down from a multi-GB out-of-memory crash |
| 📉 1.5 GB → 120 MB on disk | columnar Parquet + Snappy compression |
Where the Risk Lives
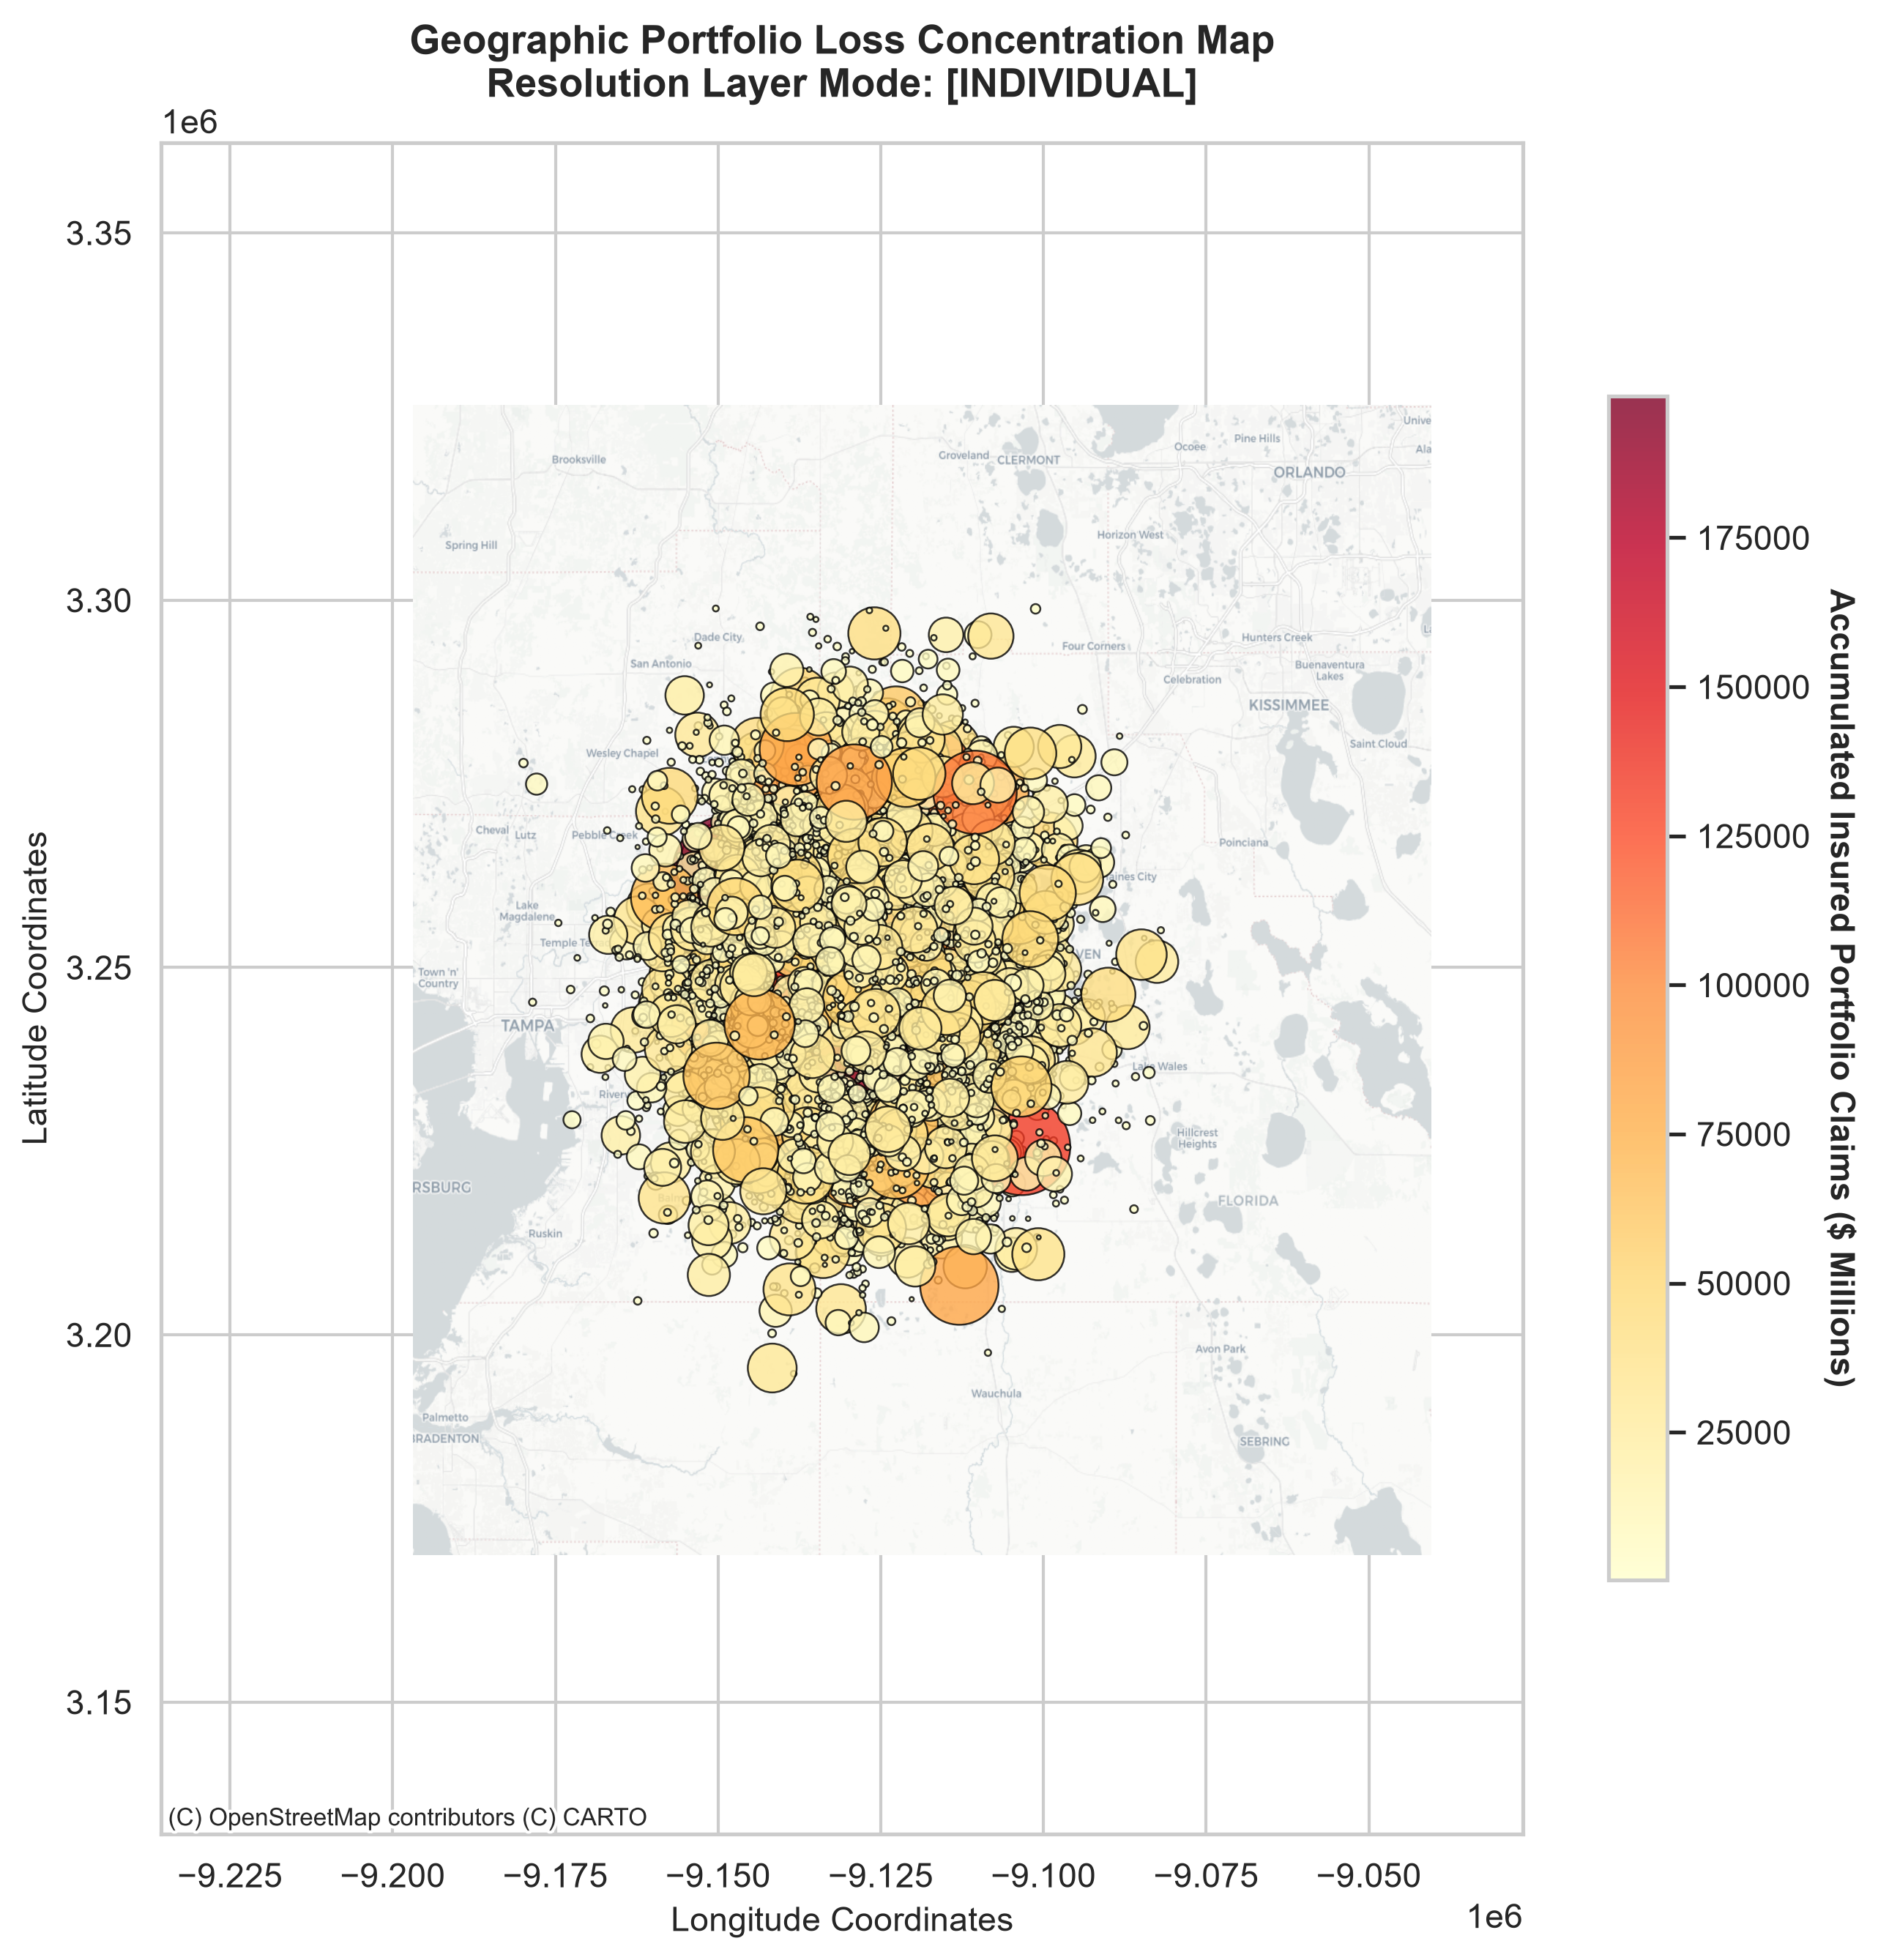 Insured loss accumulation across the coastal portfolio — bubble size is property value, color is simulated lifetime loss.
What It Costs to Survive the Tail
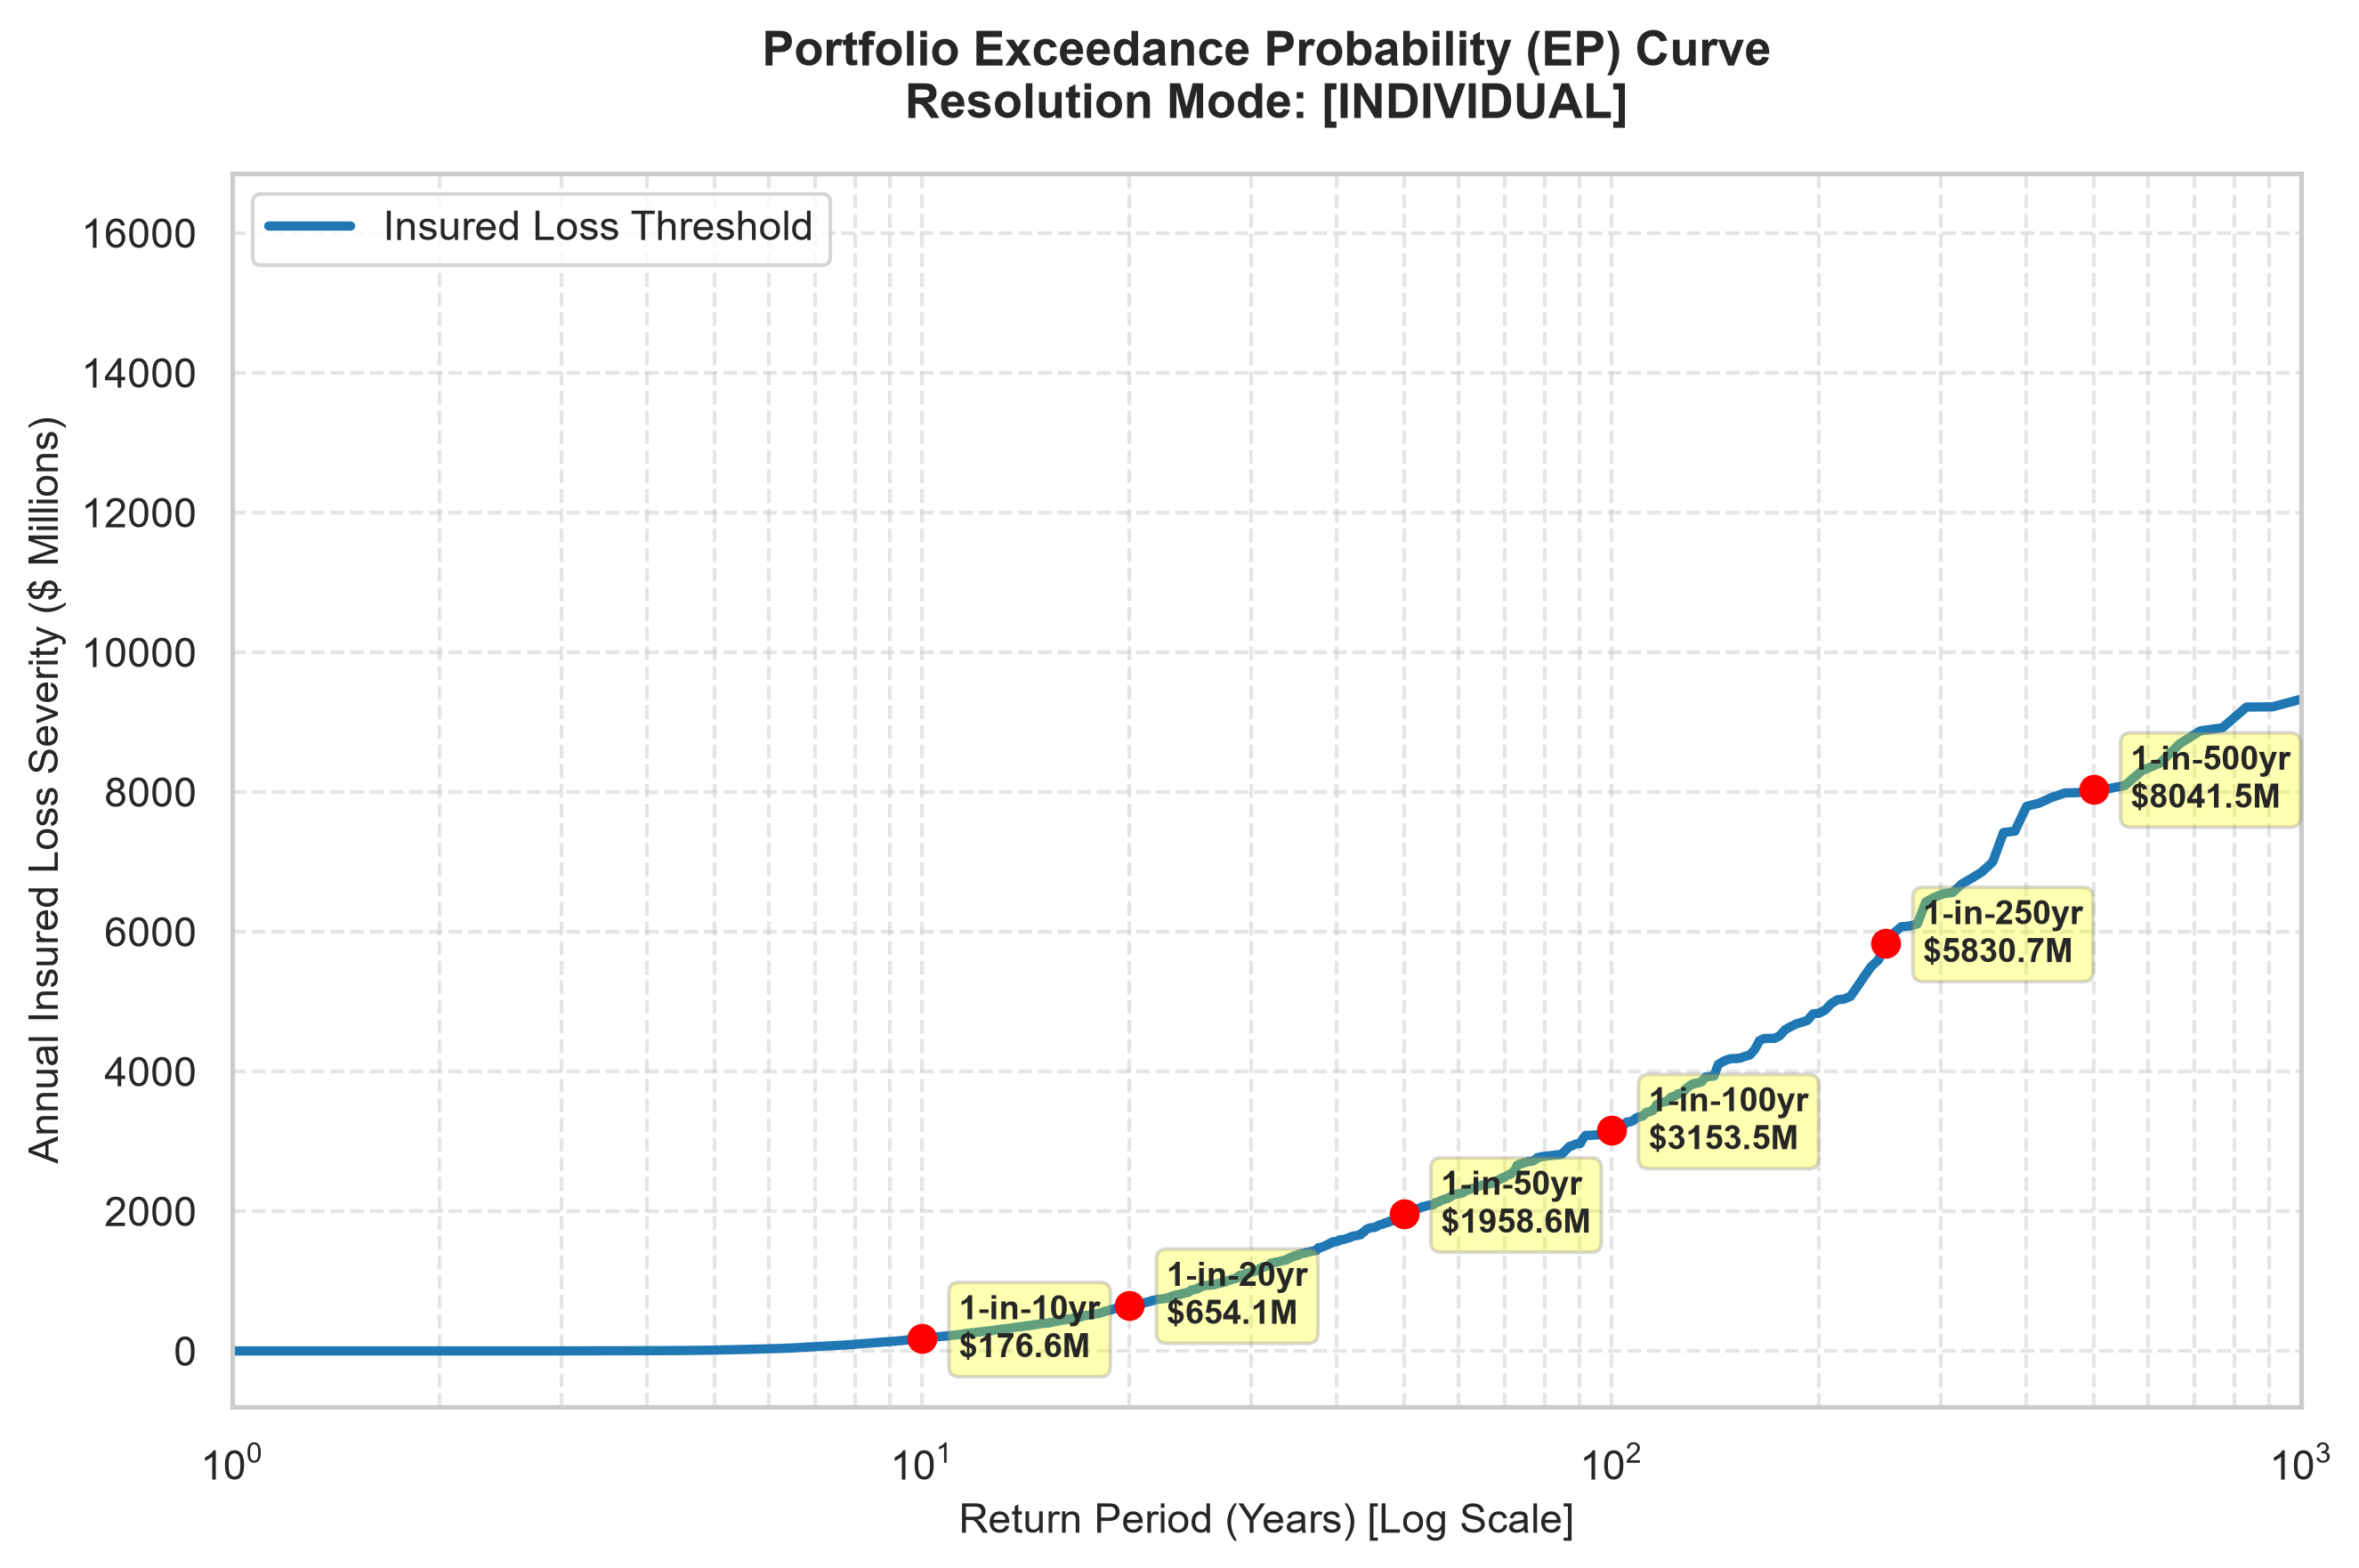 The capital question every insurer has to answer: how much do I need on the balance sheet to survive a 1-in-100 or 1-in-500 year storm?
| Return Period | Insured Loss |
|---|---|
| 1-in-10 years | $124,967 |
| 1-in-50 years | $138.3M |
| 1-in-100 years (solvency benchmark) | $381.7M |
| 1-in-500 years (ruin boundary) | $1.87B |
Who Pays, By Construction Type
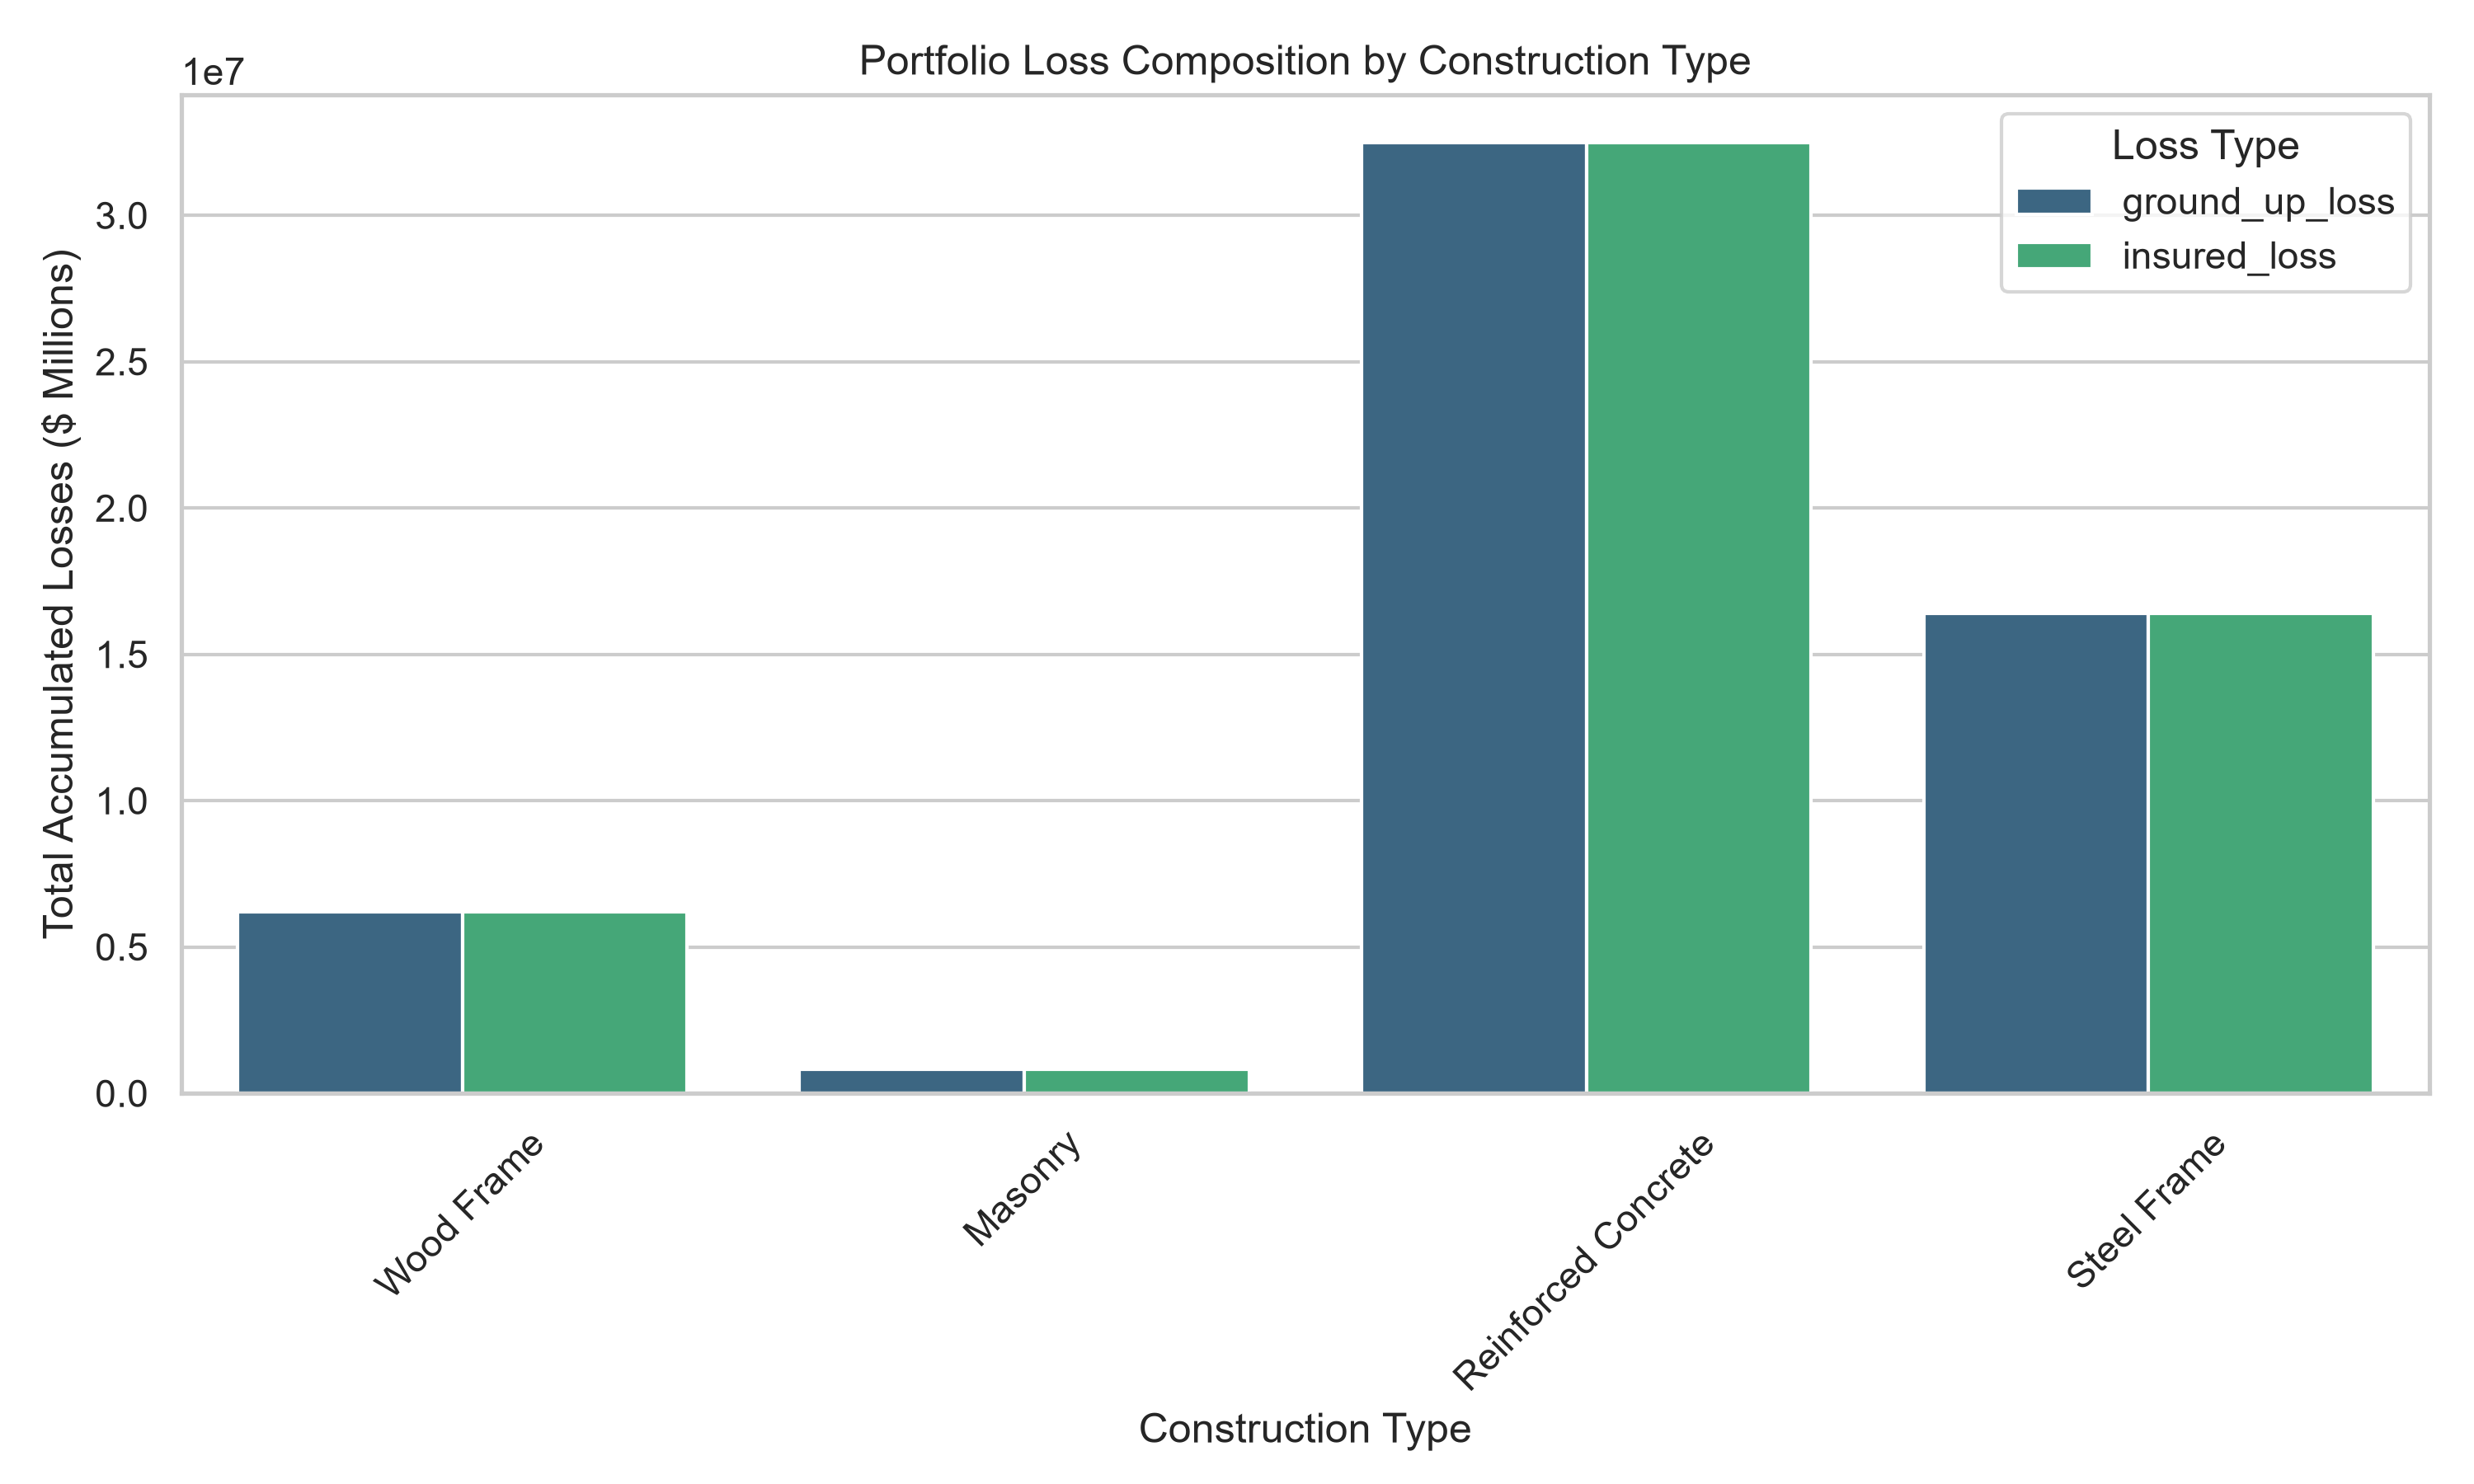 Wood-frame residential absorbs disproportionate damage relative to reinforced-concrete commercial — exactly what 80 years of wind engineering would predict.
How It Works
Four linked stages: the standard architecture across the cat-modeling industry:
- Hazard — Fit a continuous Weibull distribution to historical storm intensities (MLE), then simulate thousands of years of new storms, including Category 5 events the historical record has never directly observed.
- Exposure — Use NOAA economic indices to realistically place a synthetic property portfolio across six high-hazard coastal counties (Miami-Dade, Harris, Charleston, and others).
- Vulnerability — Convert each property’s local wind speed into a physical damage percentage via log-normal fragility curves, by construction class.
- Financial — Apply real insurance contract terms — deductibles, policy limits — to convert physical damage into what an insurer actually pays out, then aggregate into Average Annual Loss (AAL) and Tail VaR.
The Engineering Problem Nobody Talks About
A 10,000-year catalog against a multi-thousand-property portfolio produces 500+ million event-asset interaction rows. Every naive pandas pipeline I tried died the same way:
numpy._core._exceptions._ArrayMemoryError: Unable to allocate 3.73 GiB for an array
The fix was treating this as a data engineering problem, not a modeling one:
- Streamed, never loaded. PyArrow’s
iter_batches()processes the simulation in 5M-row chunks straight to disk — RAM stays flat under 50 MB regardless of dataset size. - Binary, not text. Columnar Parquet + Snappy compression cut storage by 85%+ with zero precision loss.
- Vectorized, not looped. Replacing
iterrows()withnp.where/np.maximumpushed the math to compiled C-level array operations.
Tech Stack
Python·NumPy·pandas·SciPy·PyArrow/Parquet·Matplotlib/Seaborn\- NOAA HURDAT2 & ENOW data
See It in Action
| 💻 View code on GitHub | 📄 Full technical writeup |